Weather for Kids: Facts, Science, and Classroom Resources

Avatar of Shaimaa Olwan
Updated on: Educator Review By: Michelle Connolly

Weather for Kids: Weather shapes every single day of our lives; it decides what we wear, how we travel, whether school sports day goes ahead, and sometimes whether entire communities need to evacuate. Yet for most primary-aged children, weather is something that happens to them rather than something they understand. That gap matters.

Weather for Kids

The UK National Curriculum places weather and climate firmly in both KS1 and KS2 science and geography, and building a genuine understanding of atmospheric science early gives children a foundation they carry through to secondary level and beyond.

At LearningMole, we believe the weather is one of the richest entry points into science for younger learners. It is immediate, observable, and endlessly varied. A child who understands why the sky goes dark before a storm, how a seismograph captures an earthquake’s energy, or why tsunami waves travel so differently from ordinary ocean waves has started to think like a scientist. This article covers the science of weather in a way that works for primary classrooms and home learning alike, with facts, explanations, and activities that align with curriculum expectations for Years 1 through 6.

Whether you are a teacher building a weather topic for Year 3 geography, a parent supporting a curious child’s homework, or a home educator planning a term’s work around Earth science, this guide is structured to give you what you need. We start with the fundamentals of how weather works, move through the UK’s most astonishing weather records, explore the science of extreme phenomena, including thunderstorms, earthquakes, and tsunamis, and finish with practical classroom resources and activities to bring it all to life.

What is Weather? The Science Behind Our Skies

Weather for Kids

Weather is the short-term state of the atmosphere at a specific place and time, which you experience when you step outside on any given day. It is driven by the uneven heating of the Earth’s surface by the sun, and it is constantly changing.

The sun does not heat the Earth evenly. Land heats up faster than oceans, tropical regions absorb more energy than polar regions, and dark surfaces absorb more heat than light ones. These differences in temperature create differences in air pressure: warm air is lighter and rises, creating areas of low pressure; cool air is denser and sinks, creating areas of high pressure. Wind is simply air moving from high to low pressure to balance out the system.

As warm, moist air rises and cools, the water vapour it carries condenses into tiny water droplets. Those droplets form clouds, and when they grow heavy enough, they fall as precipitation, rain, sleet, snow, or hail, depending on the temperature. This movement of water from surface to atmosphere and back is called the water cycle, and it is the engine behind most of what we experience as weather day to day.

Weather vs Climate: An Important Distinction

Children often confuse weather and climate. This table clarifies the difference, a comparison that appears directly in the KS2 geography curriculum.

WeatherClimate
DefinitionThe state of the atmosphere at a particular place and timeThe average weather conditions in a region over a long period (usually 30 years)
TimescaleHours to daysDecades to centuries
ExampleIt is raining in London todayThe UK has a temperate maritime climate with mild, wet winters
Can it change quickly?Yes — within hoursOnly over very long time periods
Classroom analogyWhat you’re wearing todayWhat fills your wardrobe throughout the year

Astonishing Weather Facts for Young Explorers

Weather for Kids

Facts that surprise children make science stick. Here are some of the most astonishing weather facts worth sharing in KS1 and KS2 classrooms, grouped by theme.

Lightning

A single bolt of lightning heats the air around it to roughly 30,000°C, about five times hotter than the surface of the sun. The rapid expansion of that superheated air creates the sound wave we hear as thunder. Because light travels faster than sound, you always see the lightning before you hear the thunder. Each second between the flash and the rumble represents roughly one mile of distance from the strike. Lightning strikes the Earth around 100 times every second globally.

Rain

A single raindrop is not shaped like a teardrop; that is a common misconception children often carry from picture books. At the moment it falls, a large raindrop is actually shaped like the top of a hamburger bun: flattened underneath by air pressure and rounded on top. Smaller raindrops are nearly spherical. The wettest inhabited place in the UK is Borrowdale in the Lake District, which records an average of over 3,000 mm of rainfall a year. For context, London receives around 600 mm annually.

Wind

The fastest wind speed ever recorded on Earth was 408 km/h, measured during Tropical Cyclone Olivia in Australia in 1996. By comparison, the strongest gust recorded in the UK was 173 mph (278 km/h) at Cairngorm Summit in 1986. In a classroom context, the Beaufort Scale, created by Royal Navy officer Sir Francis Beaufort in the early 19th century, provides children with an observable way to estimate wind speed by observing how the environment responds.

The Beaufort Wind Scale: A Kid-Friendly Reference

ForceDescriptionWhat You SeeSpeed (km/h)
0CalmSmoke rises vertically; leaves stillUnder 1
2Light breezeLarge branches in motion; umbrellas are difficult to use6–11
4Moderate breezeSmall branches move; dust and paper raised20–28
6Strong breezeSmall branches move; dust and paper are raised39–49
8GaleTwigs break; walking is difficult62–74
10StormTrees uprooted; serious structural damage89–102
12HurricaneDevastating; widespread destructionOver 118

Extreme Weather: Nature at Its Most Powerful

Weather for Kids

Extreme weather captures children’s imaginations and provides an opportunity to discuss natural hazards in a curriculum-aligned way. Here is a look at three of the most significant extreme weather phenomena, each with clear scientific explanations suitable for upper KS2.

Tsunamis: When the Ocean Floor Moves

A tsunami is a series of enormous waves triggered by a sudden displacement of a large volume of water. Most commonly, this happens when an underwater earthquake causes tectonic plates to shift. Underwater landslides and volcanic eruptions can also generate tsunamis. The word itself comes from Japanese and means ‘harbour wave.’

Tsunamis are often misidentified as tidal waves, but tidal waves are caused by the gravitational pull of the moon and sun on the ocean. The key difference lies in how the water moves. Ordinary waves involve water moving in circular motion; tsunami waves involve the entire column of water, sometimes thousands of metres deep, surging forward in a near-straight line. That is why they carry so much more energy and are so destructive when they reach shallow coastal waters and rise dramatically in height.

Tsunamis are most common in the Pacific Ocean, particularly in South and Southeast Asia, where tectonic plate boundaries lie close to densely populated coastlines. Recognising the warning signs, such as a sudden and unusual withdrawal of the sea from a beach or the ground shaking significantly, can save lives. This makes tsunami science both educationally valuable and practically important for children with family connections to affected regions.

Earthquakes: When the Ground Beneath Us Shifts

The Earth is made up of four layers: the inner core, the outer core, the mantle, and the crust. The crust is thin compared to the layers below it, just 8 miles thick in places under the ocean, and it is broken into large sections called tectonic plates. These plates move slowly, driven by heat from deep within the Earth. Most of the time, this movement is gradual and barely perceptible. But when plates get stuck together, and pressure builds up over time, the sudden release of that pressure sends vibrations through the ground in every direction. That is an earthquake.

Scientists measure earthquakes using seismographs, which detect the vibrations through a weighted pen that traces lines on paper or a digital sensor. The resulting trace is called a seismogram, and its shape tells seismologists how powerful the earthquake was. The Richter scale, developed in the mid-1930s, rates earthquakes from 0 to 10. A magnitude 3 earthquake is barely noticeable; a magnitude 7 can topple buildings. The most powerful earthquake ever recorded was a 9.5 in Chile in 1960.

For KS2 children, the key understanding is that earthquakes are not random; they occur most often along plate boundaries. This is why countries like Japan and New Zealand experience far more earthquakes than the UK, where LearningMole is based. That said, the UK is not immune: minor earthquakes do occur, particularly in Wales and the English Midlands.

Thunderstorms: Electricity in the Sky

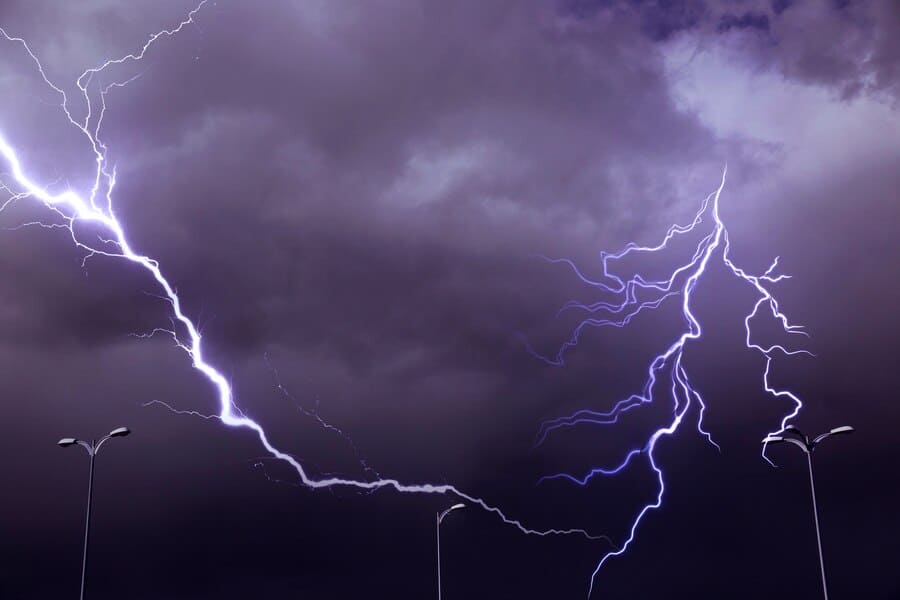
Thunderstorms develop from cumulonimbus clouds, the towering, dark-based clouds that can stretch from just a few hundred metres above the ground to more than 12 km into the atmosphere. Inside these clouds, ice crystals and water droplets collide constantly as powerful updrafts and downdrafts circulate. This collision strips electrons from particles, creating a massive electrical charge. When the difference in charge between the cloud and the ground (or between different parts of the cloud) becomes large enough, the energy discharges as lightning.

Thunder is the direct result of lightning, not a separate phenomenon. The bolt superheats the air around it so rapidly that it expands into a shockwave, which is the sound we hear. Because light travels at 299,792 km per second and sound travels at around 343 metres per second, you can calculate how far away a storm is by counting the seconds between the lightning flash and the thunder, then dividing by three to get the distance in kilometres.

Thunderstorm safety is an important life skill. Lightning is statistically more dangerous than hurricanes in terms of annual deaths globally. If caught outside, children should move indoors or into a hard-topped vehicle, avoid tall trees, open water, and high ground, and not use metal objects. If inside, staying away from windows, corded telephones, and water pipes offers additional safety.

Measuring the Weather: Become a Junior Meteorologist

Weather for Kids

Meteorology, the scientific study of weather, gives children a direct link between abstract concepts and real-world observation. Teaching children how weather is measured develops skills in data handling, scientific enquiry, and geography simultaneously, making it one of the most cross-curricular topics in the primary science programme of study.

Essential Weather Instruments

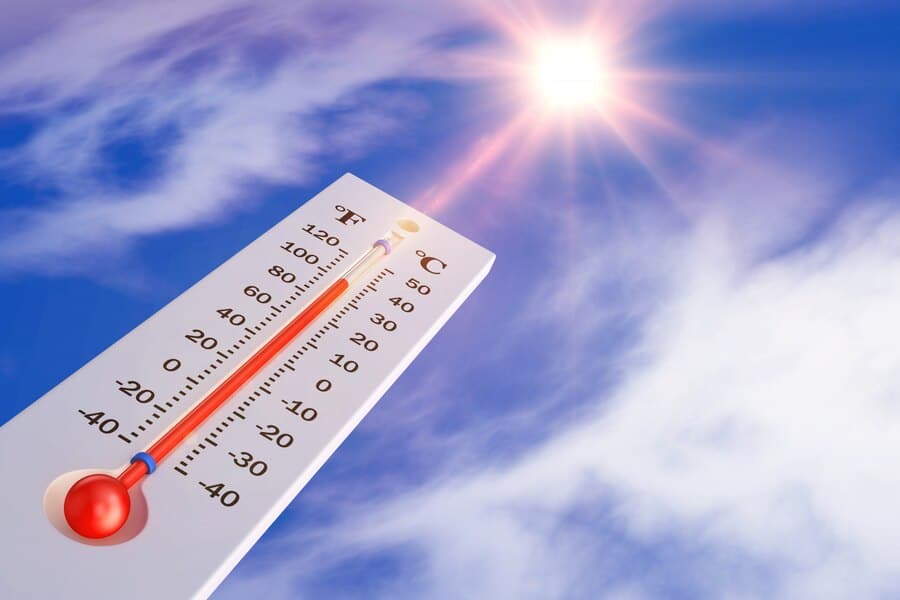
  • Thermometer: Measures temperature in degrees Celsius (°C). A standard classroom activity is tracking daily temperatures over a week and creating a bar or line chart, a task that meets both science and maths objectives.
  • Rain gauge: A cylinder that collects rainfall and measures it in millimetres. Children can make a simple version from a plastic bottle. Tracking weekly rainfall supports data handling in Year 3 and Year 4 maths.
  • Anemometer: Measures wind speed. A cup anemometer, the most common design, uses rotating cups to count revolutions per minute, which are then converted to wind speed. Homemade versions can be built from paper cups, dowels, and a pencil.
  • Barometer: Measures air pressure. Falling pressure often signals incoming poor weather; rising pressure often signals improving conditions. The Met Office monitors pressure patterns across the UK to produce forecasts.
  • Wind vane: Shows wind direction. When combined with an anemometer, it provides a complete picture of local wind conditions.

How the Met Office Predicts the Weather

The Met Office, based in Exeter, is the UK’s national weather service and one of the most respected meteorological organisations in the world. It uses a network of over 200 land-based weather stations, plus satellite data, ocean buoys, and weather balloons, to create models of atmospheric conditions. These models run on some of the world’s most powerful supercomputers, processing millions of data points to generate forecasts up to 14 days ahead. For children, exploring what the Met Office does provides a vivid example of how science, mathematics, and technology combine in a real-world career.

Weather and the UK Environment

The UK’s temperate maritime climate, with cool summers, mild winters, and year-round rainfall, shapes its unique habitats and biodiversity. The amount of rainfall a region receives determines whether its uplands are covered in blanket bog, heather moorland, or broadleaf woodland. April showers are not just a saying: the combination of spring warmth and rainfall triggers wildflower germination across British meadows and woodland floors.

Climate change is shifting these patterns. The UK’s ten warmest years on record have all occurred since 2002, and the country recorded its first 40°C temperature in July 2022. More intense rainfall events, longer dry periods, and more frequent storm surges along coastal areas are all documented trends. The Department for Education’s sustainability strategy positions climate literacy as a cross-curricular priority, and weather science is a natural entry point for these conversations at the primary level.

“Weather is one of those rare topics where every child already has experience and opinions before they arrive in your classroom. That’s a gift for a teacher. Our job is to take what they’ve felt and noticed, rain on the way to school, frost on a winter morning, thunder that made them jump, and help them understand the science behind it. When children realise that lightning and thunder are the same event seen from different physical perspectives, you can see the moment it clicks.”

— Michelle Connolly, Founder of LearningMole and former teacher with over 15 years of classroom experience

Teaching Resources and Support

Amazing Recycling Facts

Classroom Resources from LearningMole

LearningMole is a UK educational platform providing curriculum-aligned video resources and teaching materials for primary schools, created by Michelle Connolly and a team of experienced educators. The platform’s science and geography content covers weather, the water cycle, Earth and space, and living things — all aligned to the UK National Curriculum for EYFS through KS2.

For teachers covering weather in KS1 or KS2, LearningMole’s resources include video explanations of key concepts, activity frameworks, and visual aids designed to support whole-class teaching and independent learning. The platform’s approach to science content follows the same Concrete-Pictorial-Abstract progression used in maths teaching, grounding each concept in observable, everyday experience before moving to diagrams and scientific vocabulary.

Explore LearningMole’s science and geography resources

Supporting Learning at Home

Parents can reinforce classroom weather science with simple activities that require no specialist equipment. A seven-day weather diary, where children record temperature, rainfall, wind direction, and cloud types daily, builds observation skills and provides real data for graphing. LearningMole’s video resources work particularly well for home learning because they explain concepts visually before introducing formal vocabulary, which matches how children build understanding outside school.

  • Keep a weather diary for a week and graph the results
  • Make a rain gauge from a plastic bottle and track weekly rainfall
  • Try the ‘cloud in a jar’ experiment: heat water in a jar, place ice on top, and spray hairspray inside — the conditions mimic cloud formation
  • Watch the sky at different times of day and sketch the cloud types you see
  • Calculate the distance of a thunderstorm using the flash-to-thunder method

Frequently Asked Questions About Weather

Weather for Kids

What is weather, and how is it different from climate?

Weather refers to the short-term atmospheric conditions at a specific location, such as what it is like outside right now or today. Climate refers to the long-term average of those conditions over at least 30 years. A helpful way to explain this to primary-aged children: weather is what you wear today; climate is what fills your wardrobe. The UK has a temperate maritime climate, meaning generally mild and wet conditions throughout the year, but the actual weather on any given day can vary widely from that average.

What types of weather are covered in the UK National Curriculum?

At KS1, children observe and describe weather associated with the seasons and how day length varies. At KS2, geography builds on this to include weather patterns worldwide, the water cycle, and climate zones. The science curriculum introduces vocabulary related to evaporation, condensation, and the water cycle in Years 4 and 5. Upper KS2 geography covers climate change and its impact on environments and livelihoods. LearningMole’s resources are mapped to these curriculum stages to support planning.

How do you explain weather to a young child?

The most effective approach for KS1 and lower KS2 children is to start with direct observation. Ask children to describe what they can see, feel, and hear outside. From those observations, introduce simple vocabulary (sunny, cloudy, rainy, windy, snowy) before building toward explanations of why the weather changes. The analogy of the atmosphere as a warm blanket around the Earth helps children understand why it traps heat and why its movement creates wind. Keep explanations grounded in things children can verify by looking outside; abstract concepts alone are much harder to retain at this age.

What causes thunder and lightning?

Thunder and lightning are different aspects of the same event. Inside a cumulonimbus cloud, collisions between ice crystals and water droplets create a massive electrical charge. When that charge discharges as lightning, the bolt heats the surrounding air to around 30,000°C almost instantaneously. The rapid expansion of that superheated air creates a shockwave, the sound we hear as thunder. Because light travels vastly faster than sound, the lightning is always visible before the thunder is audible. Every three seconds between flash and thunder represents approximately one kilometre of distance.

Why are tsunamis and tidal waves different things?

Tidal waves are caused by the gravitational pull of the moon and the sun on the Earth’s oceans; they are the normal daily rise and fall of sea level, which we call the tide. Tsunamis are caused by a sudden displacement of a large volume of water, most commonly by an underwater earthquake. The distinction matters because tsunamis are far more destructive: they involve the entire depth of the ocean surging forward rather than a surface movement, which gives them far greater energy when they reach shallow coastal water.

Is this content suitable for KS1 or KS2?

This article covers a range of depth appropriate across KS1 and KS2. The introductory sections on weather types and basic science suit Year 1 and Year 2 children, or can be read aloud to EYFS learners. The sections on the Beaufort Scale, the water cycle, and weather instruments are particularly well-suited to Years 3 and 4. The extreme weather sections (tsunamis, earthquakes, thunderstorms) are designed for upper KS2 (Years 5 and 6), where children can engage with more complex cause-and-effect scientific thinking. LearningMole’s resources include content mapped to each year group to support differentiated teaching.

What are good weather experiments for primary school?

Simple, observable experiments work best for primary weather science. Making a rain gauge from a plastic bottle gives children real data to record and analyse. The ‘cloud in a jar’ experiment, heating water, placing ice on the jar lid, and adding a brief spray of hairspray inside, demonstrates condensation and cloud formation visibly. Building an anemometer from paper cups, a pencil, and a straw teaches children how measuring instruments work. Running a class weather diary over two or three weeks provides enough data to introduce basic statistics such as range, mode, and mean, linking science and maths objectives.

How can climate change be explained to primary children?

At KS2, climate change is best approached through observable evidence rather than political framing. The key facts are straightforward and verifiable: the UK recorded its first 40°C temperature in July 2022, all ten of the UK’s warmest years on record have occurred since 2002, and scientists who study the atmosphere broadly agree that increasing levels of carbon dioxide and other greenhouse gases are trapping additional heat. Children can engage with this through observation, comparing recent weather records with historical averages, and through the question of what individuals and communities can do differently. The Department for Education’s sustainability and climate change strategy positions this as a cross-curricular responsibility, not just a geography topic.

Conclusion

Weather for Kids

Weather science gives primary children something rare in the curriculum: a topic they experience directly every day and yet can always learn something new about. From the physics of lightning to the tectonic forces behind earthquakes and tsunamis, the science of our atmosphere and the planet beneath it is endlessly rich. Grounding that science in UK-specific examples, the soaking rainfall of the Lake District, the Met Office’s supercomputer forecasts, and the 2022 temperature record, makes it feel real and relevant to British children in a way that generic content simply cannot.

For teachers, weather is also one of the most practically cross-curricular topics available. A week-long weather diary feeds into maths data handling. Discussion of climate zones supports geography mapping skills. The water cycle connects to Year 4 science. Extreme weather opens conversations about global communities, international news, and the human impact of natural hazards. LearningMole’s curriculum-aligned resources are designed to support exactly this kind of integrated planning, saving teachers preparation time while maintaining educational depth.

The next step for young weather scientists is to go beyond the classroom and start observing. Encourage children to check the Met Office forecast, keep a weather diary, or try one of the experiments outlined above. The most powerful thing a parent or teacher can do is give a curious child the vocabulary and framework to understand what they are already seeing. Once children know why the sky turns that particular shade of bruised yellow before a summer storm, they will never look at the weather the same way again.

Leave a Reply

Your email address will not be published. Required fields are marked *